Urban heat maps
May 23, 2021
Topics
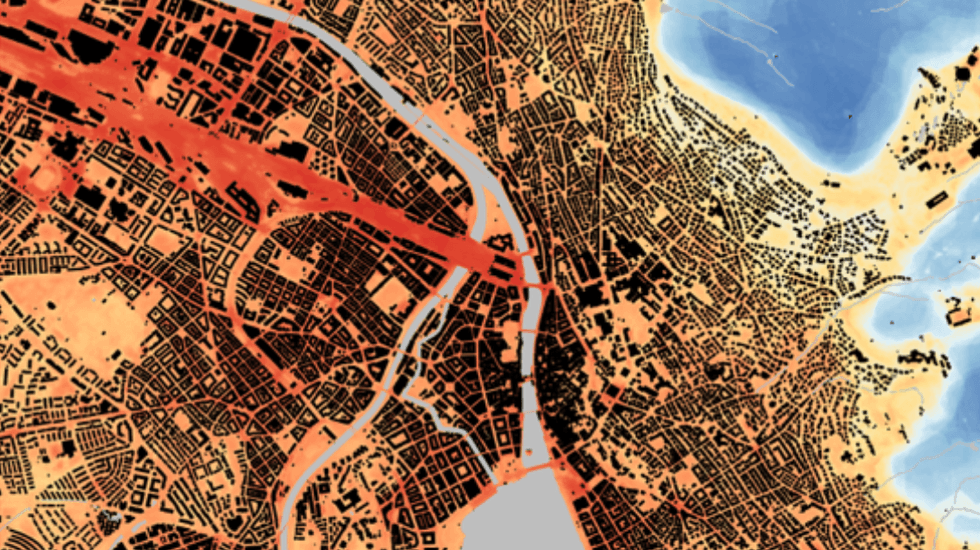
The high-resolution heat maps are created using machine learning by combining satellite data with freely available administrative data and measurements from private weather stations. Cities are particularly vulnerable to extreme heat. Therefore, understanding temperature distribution in urban areas is particularly important and affects many areas – from architecture to urban planning to public health. The […]