Urban heat maps
May 23, 2021
Topics
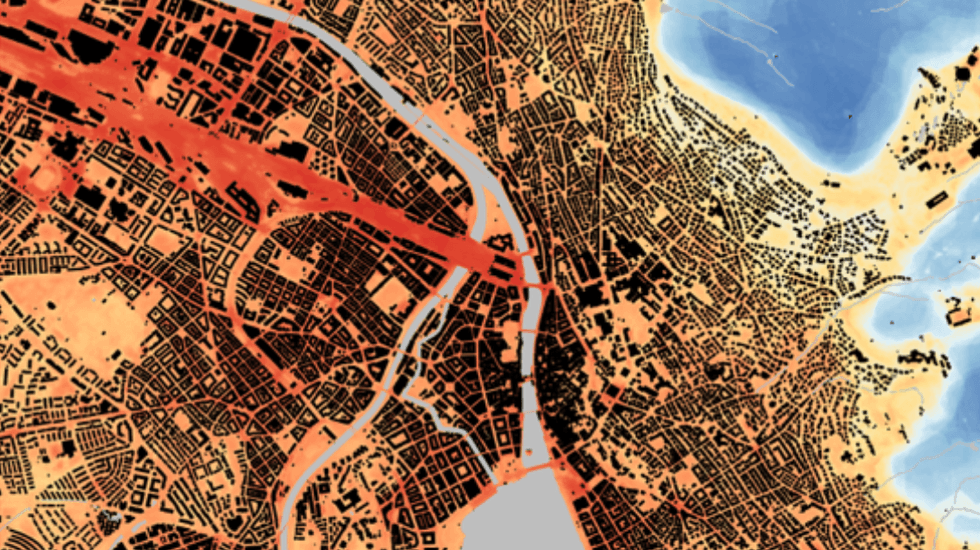
The high-resolution heat maps are created using machine learning by combining satellite data with freely available administrative data and measurements from private weather stations.
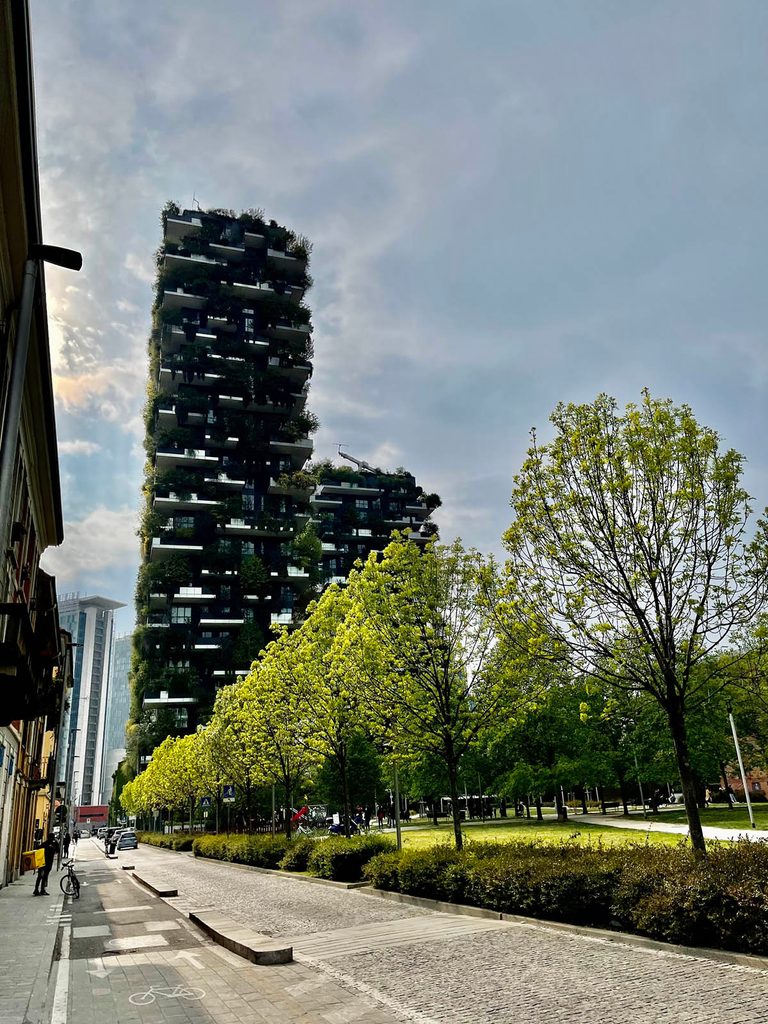
Cities are particularly vulnerable to extreme heat. Therefore, understanding temperature distribution in urban areas is particularly important and affects many areas – from architecture to urban planning to public health.
The heat maps with a resolution of 10×10 meters enable a wide range of analyses:
- Benchmarking: How severely is a particular location affected by heat compared to the city as a whole or compared to Switzerland?
- Vulnerability analyses: Who is affected by climate change and to what extent? These analyses can relate to the population (e.g., by age or by socioeconomic factors such as income) or to the building stock (e.g., by year of construction or by use).
- Cooling effects: Analysis of the cooling effect of green spaces.
- Conflicting goals: Which conflicting goals (e.g. regarding densification) can occur?
- Projections: Climate models can be used to estimate future heat stress. Heat map for the city of Zurich. Around 600 temperature sensors serve as the basis.
Heat map for the city of Zurich. Around 600 temperature sensors serve as the basis.
Urban greening as a measure against the heat